An Effective Method for Characterizing System Bandwidth in Complex Current Sensor Applications
By Wade Bussing, Ryan Dunn, and Kasey Hampton,
Allegro MicroSystems, LLC
Introduction
Driving high frequency, high amperage current in a controlled manner can prove challenging. Even when the right equipment is available, the application’s uniquely complex systems may not allow for easy injection of external currents due to load conditions or switching circuitry timing.
This application note describes multiple methods for measuring and characterizing system bandwidth, with a focus on the impulse response method.
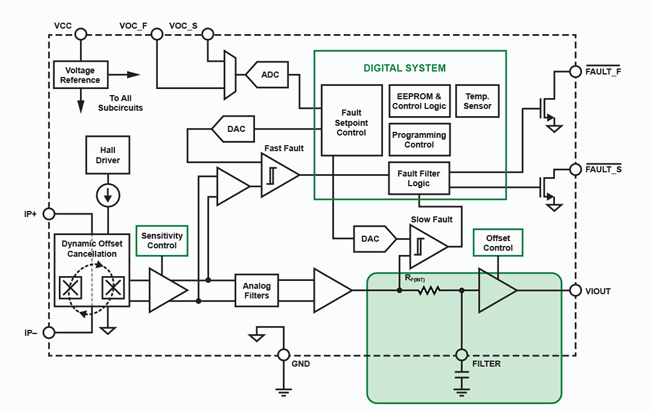
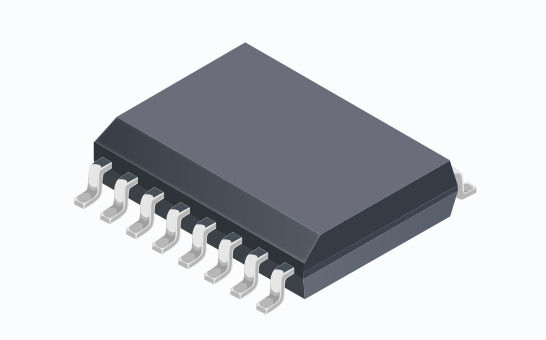
Allegro’s ACS720 is the perfect device to validate the test methods outlined here. The ACS720 is a highly accurate integrated current sensor IC with very low sensor drift over temperature, dual overcurrent fault channels, a typical bandwidth of 120 kHz, and an external filter feature.
A functional block diagram of the ACS720 is shown in Figure 1 with the filter circuit highlighted. Refer to the ACS720 device datasheet on the Allegro website for more information.
Bandwidth Measurement
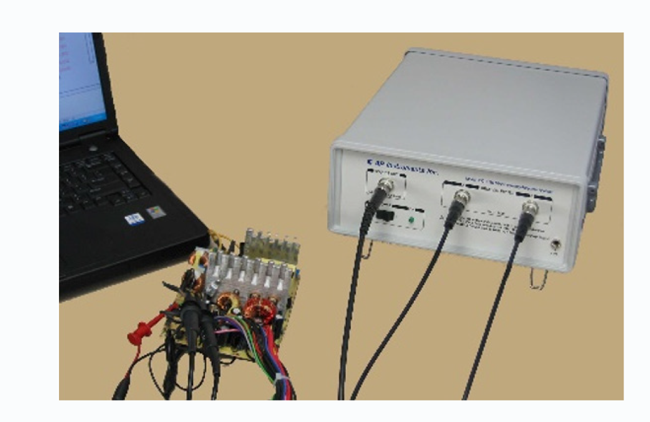
The block diagram in Figure 2 shows a standard bench setup for testing system bandwidth.

An equipment list is shown in Table 1. Item numbers correspond to the numbered blocks in Figure 2. See Appendix A for links to the manufacturers’ websites and product pages.
Table 1: Equipment List [a]
| # | Item | Manufacturer |
| 1 | AP300 Network Analyzer | AP Instruments |
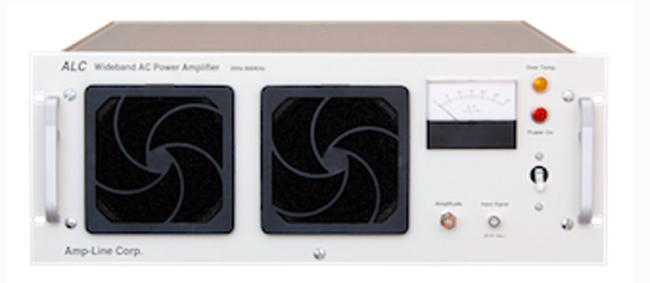
| 2 | Wideband Amplifier | AMP-Line Corporation |
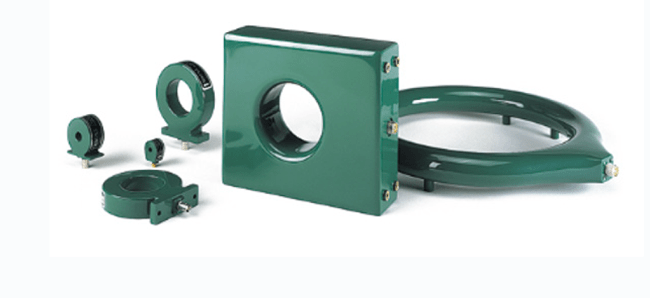
| 3 | 4997 Current Monitor Probe | Pearson |
| 4 | ACS720 Current Sensor IC | Allegro MicroSystems |
The network analyzer supplies a control signal to the wideband amplifier, which can sweep AC currents from 10 Hz to hundreds of kHz. The input current is observed using a high-bandwidth precision current monitor, while the ACS720 analog output is measured directly. The network analyzer compares the sensor output (channel B) to the reference monitor probe (channel A).
Approximating System Bandwidth Using the Rise Time
The frequency sweep test method is most practical for application circuits that contain minimal switching circuitry. Consider the simplified inverter schematic in Figure 3. Popular sensing locations for Allegro’s integrated current sensors (CS) are indicated.
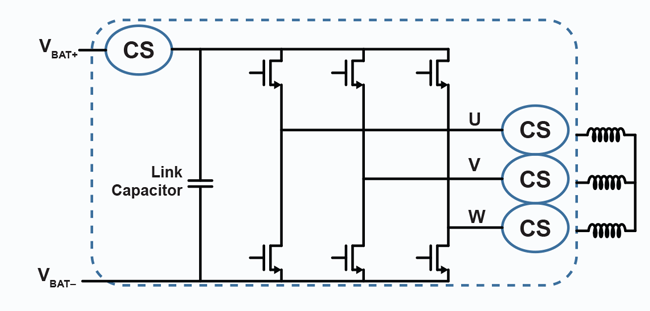
One solution for bandwidth validation may be a control scheme for switching the FETs in a single phase at various frequencies while observing the output. However, wide adjustment of the switching frequencies is not feasible, and accurate in-phase measurement of the reference current may be challenging.
A second solution is to short the high-side and low-side FETs in a single phase and sweep current using an external source.
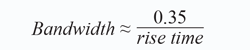
However, other components, such as the large link capacitor, or the small load of the FETs, inhibit the amplifier’s ability to sweep high-frequency current. In this case, an alternative test method may be used: the rise time method. Rise time is defined as the time it takes for a system to travel from 10% to 90% of its steady-state value in response to a fast input current step.
A fast input step is generated with the inverter system in Figure 3 by briefly shorting the high-side and low-side FETs of a single phase. This allows a brief shoot-through current event, and the rise time of the sensor output can then be measured. The bandwidth of the system may be approximated using the rise time measurement and the following equation:
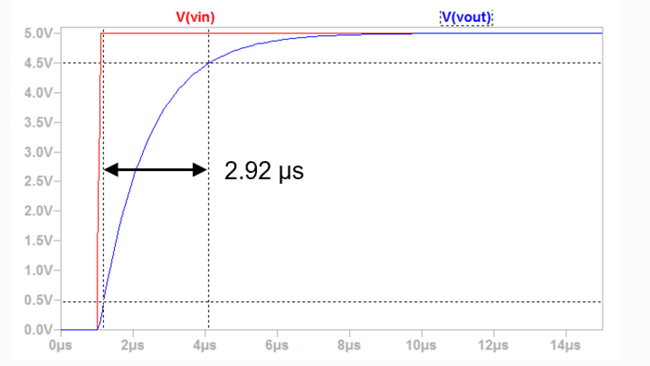
A SPICE model of a low-pass filter with cutoff frequency of 120 kHz was used to illustrate the method, shown in Figure 4.
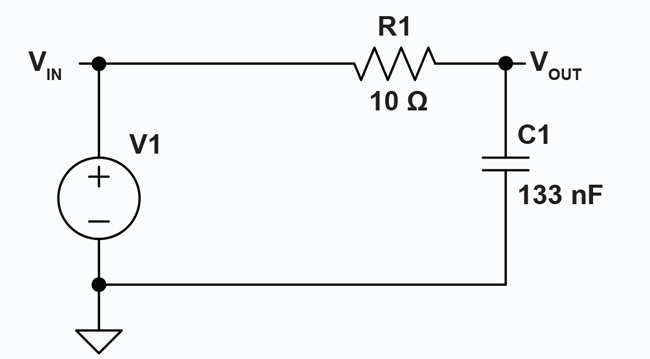
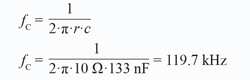
The cutoff frequency of the low-pass filter was calculated to be ≈120 kHz using the following equation:
A voltage step from 0 to 5 V was injected at VIN, with a rise time of 100 ns. The rise time of VOUT was measured to be 2.92 μs. The results of the simulation are plotted in Figure 5.
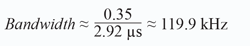
The bandwidth of the low pass filter was confirmed using the measured rise time and the bandwidth approximation equation:
Equation 3:
It should be noted that the rise time of the input signal directly affects the response of the system. A fast input rise time is recommended for this testing (< 1 μs). Considerations should be made for the impact of input rise time on the overall measurement.
Applying the Rise Time Approximation
The ACS720 datasheet typical specification for internal bandwidth is 120 kHz. The device measured in Figure 6 shows a bandwidth of around 128 kHz.
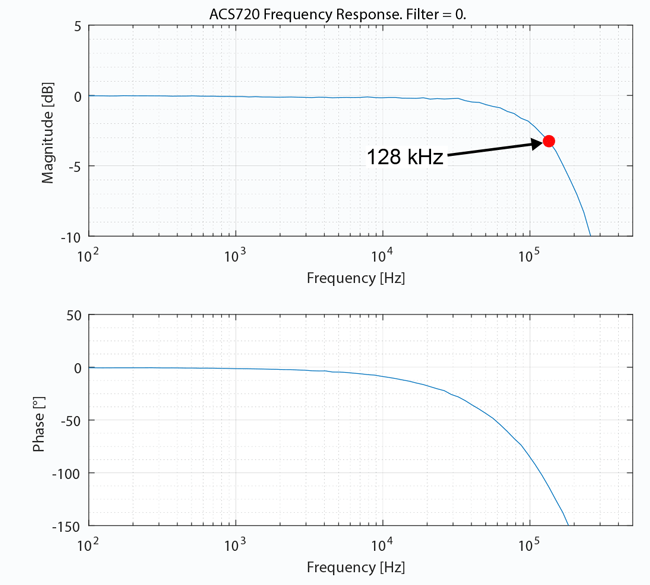
and Phase Relative to a Sinusoidal Input Current

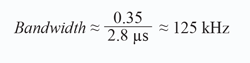
The average rise time of the ACS720 was measured to be 2.8 μs, which can be inserted into the bandwidth approximation equation:
Equation 4:
The rise time result in Figure 7 has a close correlation to the bandwidth measured in Figure 6. Although correlation could be further improved by using a faster input step, the 1 μs pulse in Figure 7 is sufficient for approximation.
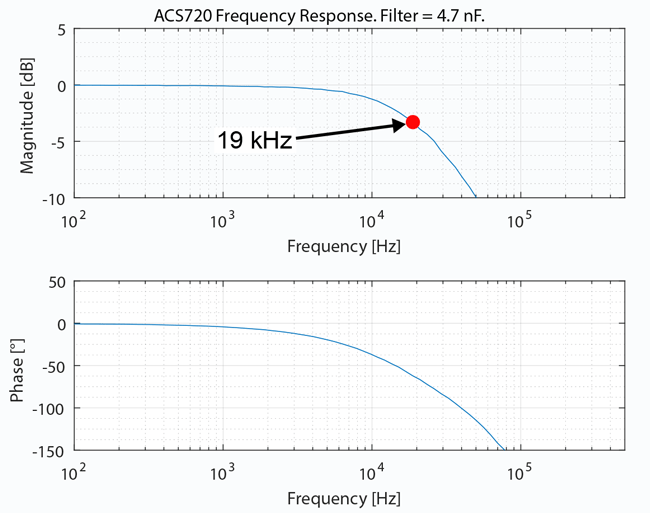
Adding a 4.7 nF capacitor to the ACS720 FILTER pin reduces the sensor’s cutoff frequency to 18.8 kHz. The frequency response and rise time were retested with the added filter capacitor, shown in Figure 8 and Figure 9.
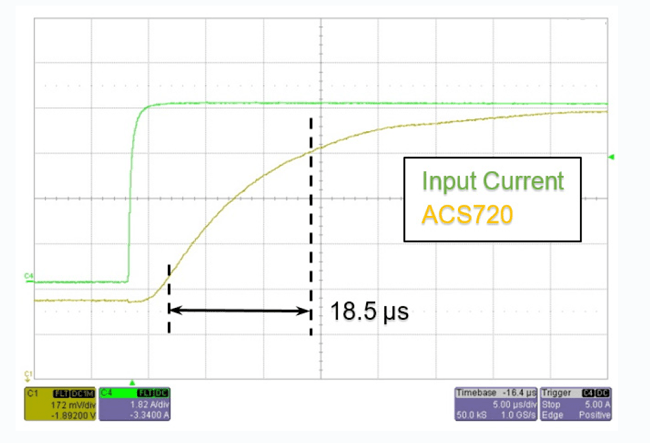
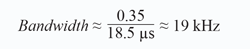
Using the measured rise time and approximation equation, the new sensor bandwidth is confirmed:
Equation 5:
Conclusion
The rise time method is an effective way to characterize system bandwidth when complexities prohibit the use of standard test procedures or when the appropriate equipment is not available.
APPPENDIX A: Equipment Manufacturer List
AP300 NETWORK ANALYZER
Manufacturer: AP Instruments
Product Link: http://www.apinstruments.com/products.html
PEARSON 4997 CURRENT MONITOR PROBE
Manufacturer: Pearson
Product Selection Page: http://www.pearsonelectronics.com/products/wideband-current-monitors
Model 4997 Datasheet Link: https://www.pearsonelectronics.com/pdf/4997.pdf
AMP-LINE CORPORATION WIDEBAND AMPLIFIER
Manufacturer: AMP-LINE Corporation
Product Selection Page: http://www.amp-line.com/products/wideband-power-amplifiers-lf-to-hf
ALLEGRO ACS720
Manufacturer: Allegro
Product Page: /en/products/sense/current-sensor-ics/zero-to-fifty-amp-integrated-conductor-sensor-ics/acs720
Copyright ©2018, Allegro MicroSystems, LLC
The information contained in this document does not constitute any representation, warranty, assurance, guaranty, or inducement by Allegro to the customer with respect to the subject matter of this document. The information being provided does not guarantee that a process based on this information will be reliable, or that Allegro has explored all of the possible failure modes. It is the customer’s responsibility to do sufficient qualification testing of the final product to insure that it is reliable and meets all design requirements.